پرونده:Fourier transform time and frequency domains (small).gif

از testwiki
پرش به ناوبری پرش به جستجو
Fourier_transform_time_and_frequency_domains_(small).gif (۳۰۰ × ۲۴۰ پیکسل، اندازهٔ پرونده: ۲۶۵ کیلوبایت، نوع MIME پرونده: image/gif، چرخش‌دار، ۹۳ قاب، ۳۷ ثانیه)

این پرونده از ویکی‌انبار است و ممکن است توسط پروژه‌های دیگر هم استفاده شده باشد. توضیحات موجود در صفحهٔ توضیحات پرونده در آنجا، در زیر نشان داده شده است.

توضیح
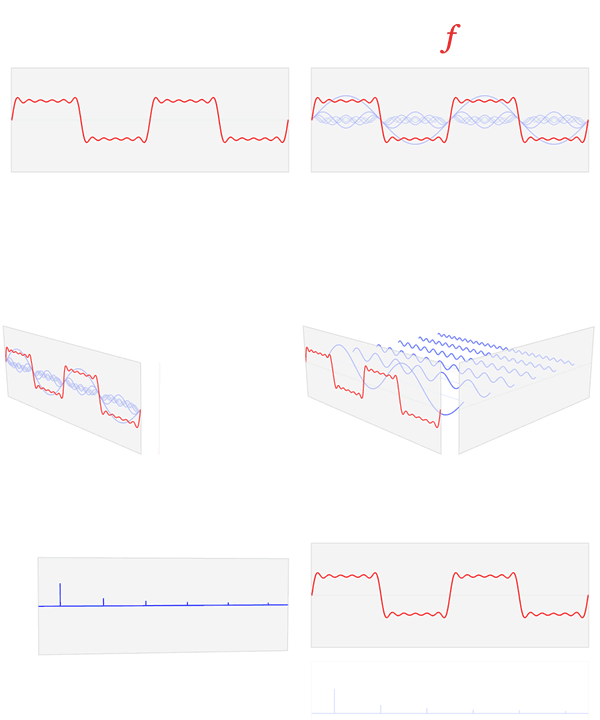
English: A visualization of the relationship between the time domain and the frequency domain of a function, based on its Fourier transform.

The Fourier transform takes an input function f (in red) in the "time domain" and converts it into a new function f-hat (in blue) in the "frequency domain".

In other words, the original function can be thought of as being "amplitude given time", and the Fourier transform of the function is "amplitude given frequency".

Shown here, a simple 6-component approximation of the square wave is decomposed (exactly, for simplicity) into 6 sine waves. These component frequencies show as very sharp peaks in the frequency domain of the function, shown as the blue graph.
تاریخ
منبع اثر شخصی
پدیدآور Lucas V. Barbosa
دیگر نسخه‌ها (separate files were necessary due to the awfulness of MediaWiki's thumbnail generator)

اجازه‌نامه

Public domain من، دارنده حق تکثیر این اثر، این اثر را به مالکیت عمومی منتشر می‌کنم. این قابل اجرا در تمام نقاط جهان است.
در برخی از کشورها ممکن است به صورت قانونی این امکان‌پذیر نباشد؛ اگر چنین است:
من اجازهٔ استفاده از این اثر را برای هر مقصودی، بدون هیچ‌گونه شرایطی می‌دهم، تا وقتی که این شرایط توسط قانون مستلزم نشده باشد.

عنوان

شرحی یک‌خطی از محتوای این فایل اضافه کنید

آیتم‌هایی که در این پرونده نمایش داده شده‌اند

توصیف‌ها

source of file انگلیسی

۲۷۱٬۴۶۸ بایت

۳۶٫۶۵ ثانیه

۲۴۰ پیکسل

۳۰۰ پیکسل

checksum انگلیسی

189803ab9b4ef9b75c65518f182b13a59e4cee6b

تاریخچهٔ پرونده

روی تاریخ/زمان‌ها کلیک کنید تا نسخهٔ مربوط به آن هنگام را ببینید.

تاریخ/زمانبندانگشتیابعادکاربرتوضیح
کنونی۲۳ فوریهٔ ۲۰۱۳، ساعت ۲۱:۴۴تصویر بندانگشتی از نسخهٔ مورخ ۲۳ فوریهٔ ۲۰۱۳، ساعت ۲۱:۴۴۳۰۰ در ۲۴۰ (۲۶۵ کیلوبایت)wikimediacommons>LucasVB{{Information |Description={{en|1=A visualization of the relationship between the time domain and the frequency domain of a function, based on its Fourier transform. The Fourier transform takes an input function f (in red) in the "time domain" and con...

صفحهٔ زیر از این تصویر استفاده می‌کند: